

We welcome you to Advanced Market Insights! Our goal is to provide useful insights into the mysterious world of price action. Just by understanding the material posted here, you will have be in a small crowd of people that know the probable direction of price based on science and physics, not opinion. So, without further to do, let’s take a look at the origin of Median Lines.
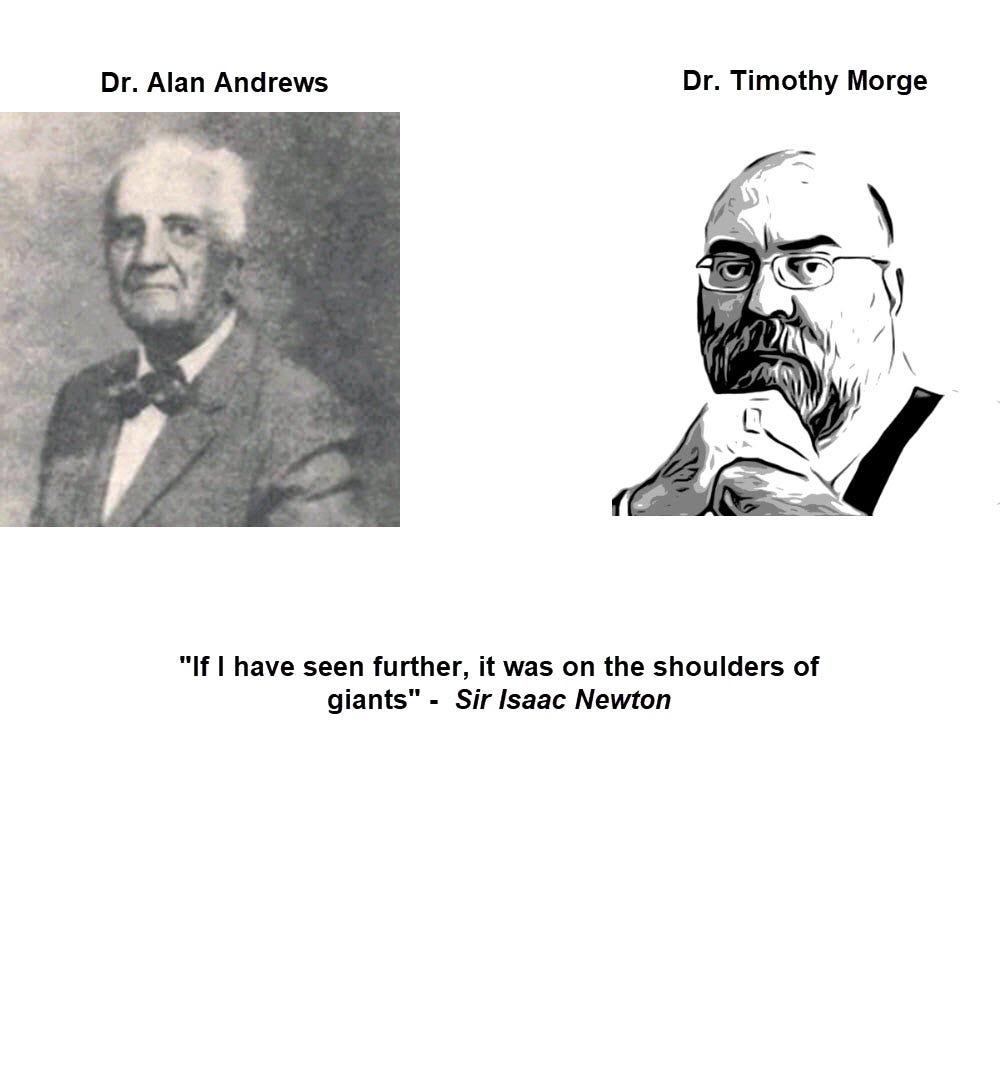
Median lines - also referred to as pitchforks were developed by Doctor Alan Andrews, are considered the only publicly known leading indicator. They will not only tell you the probable path of price, but they also will tell you the price at any time in the future that price should return to with high probability. They have their roots in physics, not opinions, not news, or social media. They do not have wants and needs and they do NOT have bills to pay. In a time when any news, or opinion represented as fact can be spread around the world in seconds, this is more important than ever.
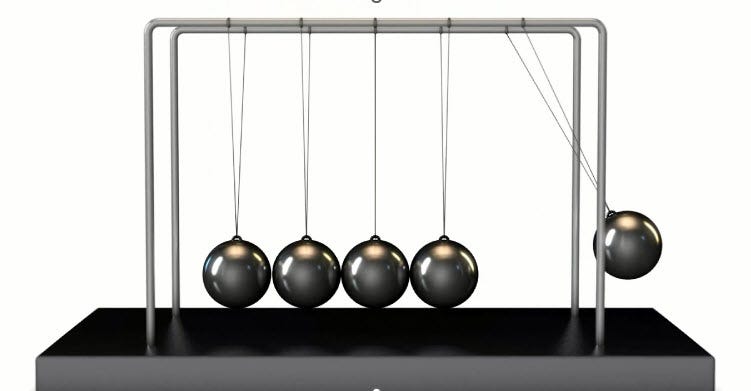
It seems only fitting to use something that we all have seen or touched in our lives at one point or another to help understand how median lines work – a Newton’s Cradle. Sir Isaac Newton was the man who gave us an deeper understanding of physic with the Three Laws of Motion. They are such simple concepts- yet they encompass our world completely because the same laws that control the Newton’s Cradle, control everything in our world without us even thinking about it. Simply put our world would not exist if these laws were not – laws. The sun may not come up tomorrow, it may not set tonight. The phases of the moon would not be there, the tides no more. The very solar system that we exist in today, would be a literal shooting gallery if the laws of physics did not control every object in the universe. You could not start your vehicle, let alone stop it, and the very seasons that many use to grow crops that feed our families, would fail to exist. Even the very organ that keeps you alive today, would not pump the blood through your body – if this law was not a law. And yet, in the facilities of higher learning, the people that should understand these laws better than anyone, simply dismiss the laws in regards to price action suggesting that the price is not controlled by these laws and is chaotic, random and unpredictable. We believe here at AMI that nothing is farther from the truth and that price movement is just an expression of energy and there are no accidents in price - ever. We believe that where price is going to be a week, month, year, or anytime in the future is already determined. It just hasn’t happened yet. More importantly, price is giving you clues as to what’s it’s path is. The authors here do not proclaim to be infallible – not even close. But what we do understand is that when price does not do what we expect, WE are wrong…..period. Most will shrug their shoulders without even trying and point at the “surprise” report, war, weather event....etc. and suggest that those events were the cause price doing what it did. At AMI, we simply know we did not take the information price was providing us and weigh it correctly. That can be very sobering as a market professional when it’s realized, but also opens up avenues of the possibility since you know that everything you need to know about where price is going, is already on the chart.
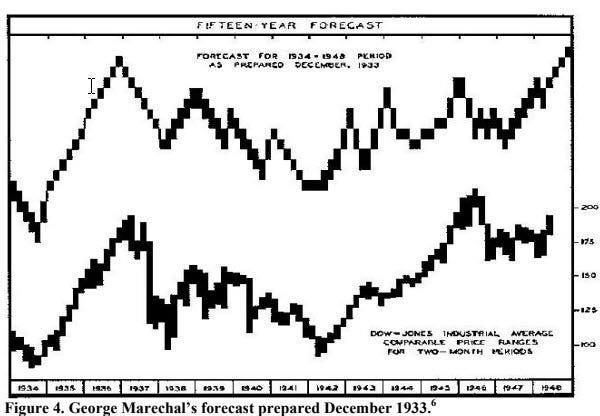
One of the greatest examples of that the markets are not random was a chart that was created by a colleague of Alan Andrews, George Marechal. George used mathematics and the laws of physics and copyrighted this now famous chart that projected the path of the stock market for the 18 years prior to the election of President Nixon. Not one professor from an institute of higher learning has even attempted – or come close to the same accomplishment. And yet these institutes of higher learning, quickly discredit any attempt – in fact teach the opposite of what George Marechal proved was possible.
The law we will be most concerned with for this lesson is Newton’s third law:
“For every action (force) in nature, there is an equal and opposite reaction”.
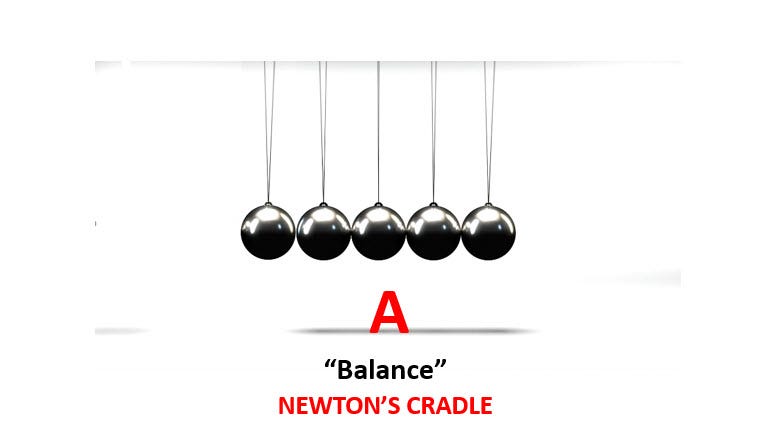
In this example of the Newtons’ cradle, we see the balls stationary. They are not moving. They are energy, but not expressing energy. We will call this “Balance”. And we will assign a letter to it…”A”.
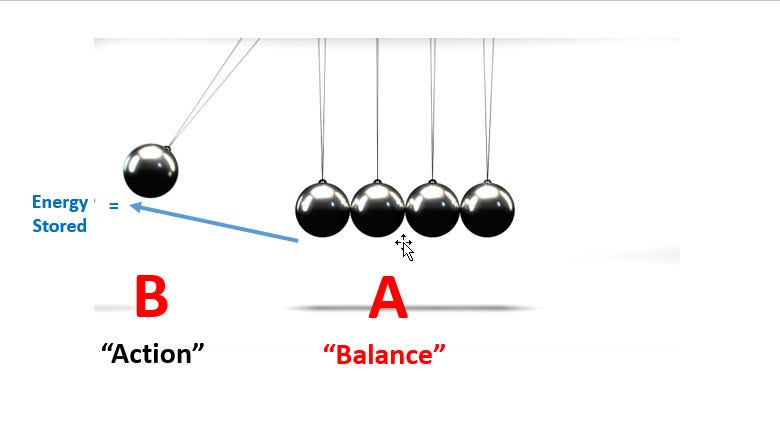
Now, let’s assume we reach down and pullback on one of the outermost balls. As the ball swing’s out, energy is transferred from the hand to the ball and is stored in the ball.
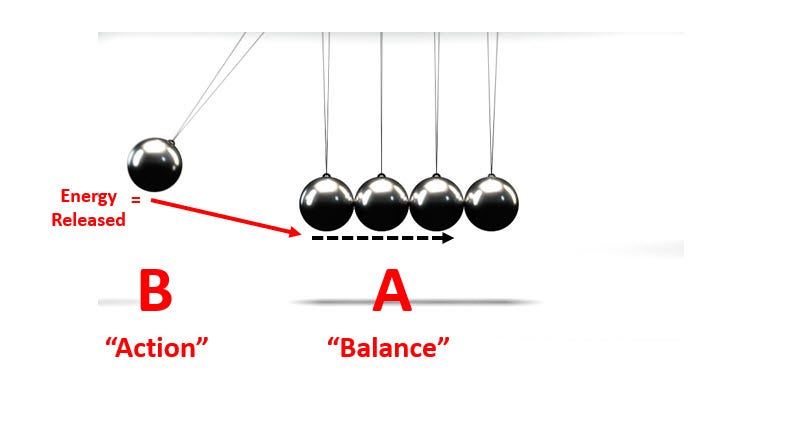
When the ball is released. What happens? The ball swings forward releasing its energy and transfers the energy through molecular structure of the stationary balls at the bottom, causing an ejection of the last ball.
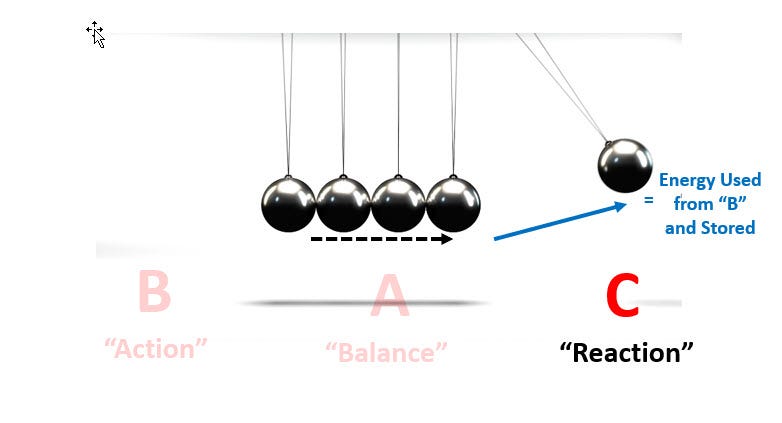
This has been done in many times in controlled environments, and without fail, if “B” has “x” amount of energy and released with all the variables being the same – it will without fail cause “C” to extend the same amount every time. So, with a high degree of certainty, you know where “C” will swing to. Granted this is a very elementary example of what happens on a price chart, but this is exactly what is happening on any price chart, on any given day. What makes it difficult is defining the other variables, which in this case is other price swings in play, some on charts lower in time, others on charts that we cannot even fathom matter- even some in dimensions that we cannot plot. Yet, the Newton’s third law works remains an immutable law in every case.
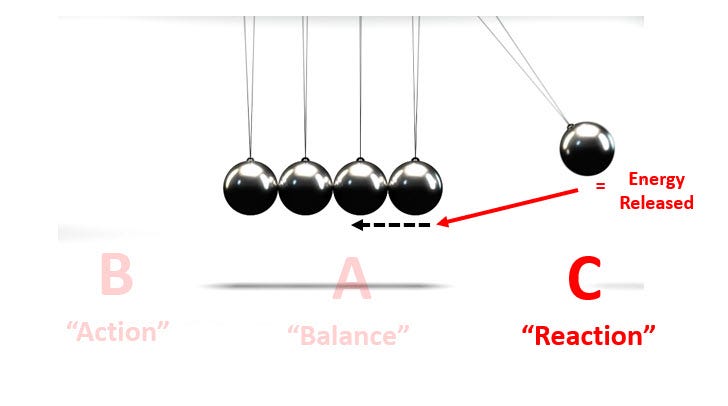
Once the ball that has been ejected runs out of energy, it stalls, then reverses and starts swing back toward the center again. This swing back to towards the center is releasing the energy stored in the ball on the swing out. The process continues on and the energy stored from “C” will now transfer through the balls and eject the outer most ball again, ejecting the ball to what we will call “D”.
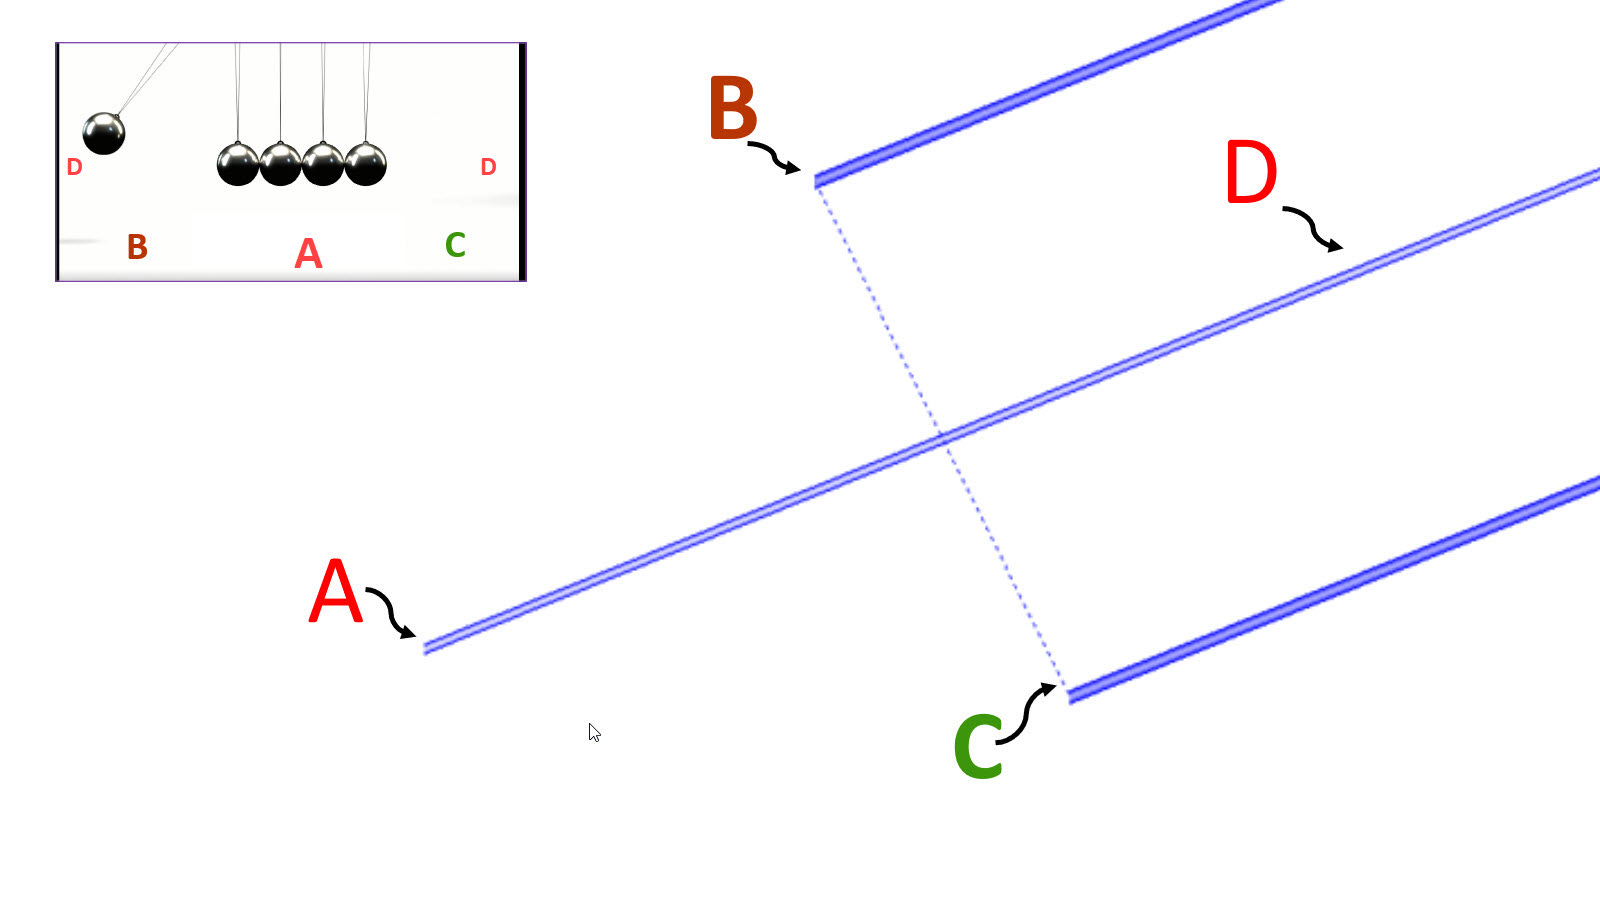
Let’s now assign the above example to a median line set. “A” will be the point on the handle, “B” is the amount of energy stored as we pulled the ball out, “C” is the extent that the ball swung out from the amount of energy stored and released from ”B”, and “D” is where the energy projects the ball, and will in turn provide the energy for the next swing. Another important thing to notice is the slope of the median line set – in this case – up. The slope of any Median Line is forecasting the probable path of price. If it’s flat, it is unlikely that an explosive move will occur that will take price far outside of the outer lines. If it’s down, the probable path of price is lower. In all cases, the slope of the lines represents the speed of which price should rise or fall. Doctor Andrews was the first that did the statistics on median lines, many have followed since including Timothy Morge. Mr. Morge had access to computing resources that Doctor Andrew’s couldn’t even think was possible. Tim did millions of iterations on time frames from small tick to monthly charts testing the probabilities of Median lines and he confirmed exactly what Doctor Andrews discovered decades before. That price has a probability of returning to “D”- the Median Line (ML), ‘about 80 percent of the time’. So not only do you know the probable path of price with a high degree of certainty, but you also know at what price should return to at any chosen time in the future and where it’s likely to run out of energy.
Doctor Andrews also developed rules to help read price and deal with the times when price cannot achieve the ML. He stated there is a high probability that:
1. Prices will reach the ML.
2. Prices will either reverse on meeting the ML or gap through it.
3. When prices pass through the ML, they will pull back to it.
4. When prices reverse before reaching the ML, leaving a “space”, they will move at least as far in the opposite direction.
5. Prices reverse at any ML or extension of a prior ML.
We now know that the Doctor Andrews was correct and that prices will reach the ML about 80% of the time. Rule #2. states that price will reverse on meeting a ML or gap through it. Doctor Andrews was not an intraday trader, and during the vast majority of his lifetime, the exchanges were closed overnight. So, gaps were much more common than they are today. Because of this, the term ‘gap’ was updated to ‘zoom’ by Mr. Morge. Statistical testing by Mr. Morge also expanded on this a bit so we will add a subscript to rule #2. His research suggests that about 43% of the time, price will zoom the ML, 43% of the time, it will reverse, and the remainder will travel along the ML until it reaches the next line. Rules 2 and 3 compliment each other. They are :
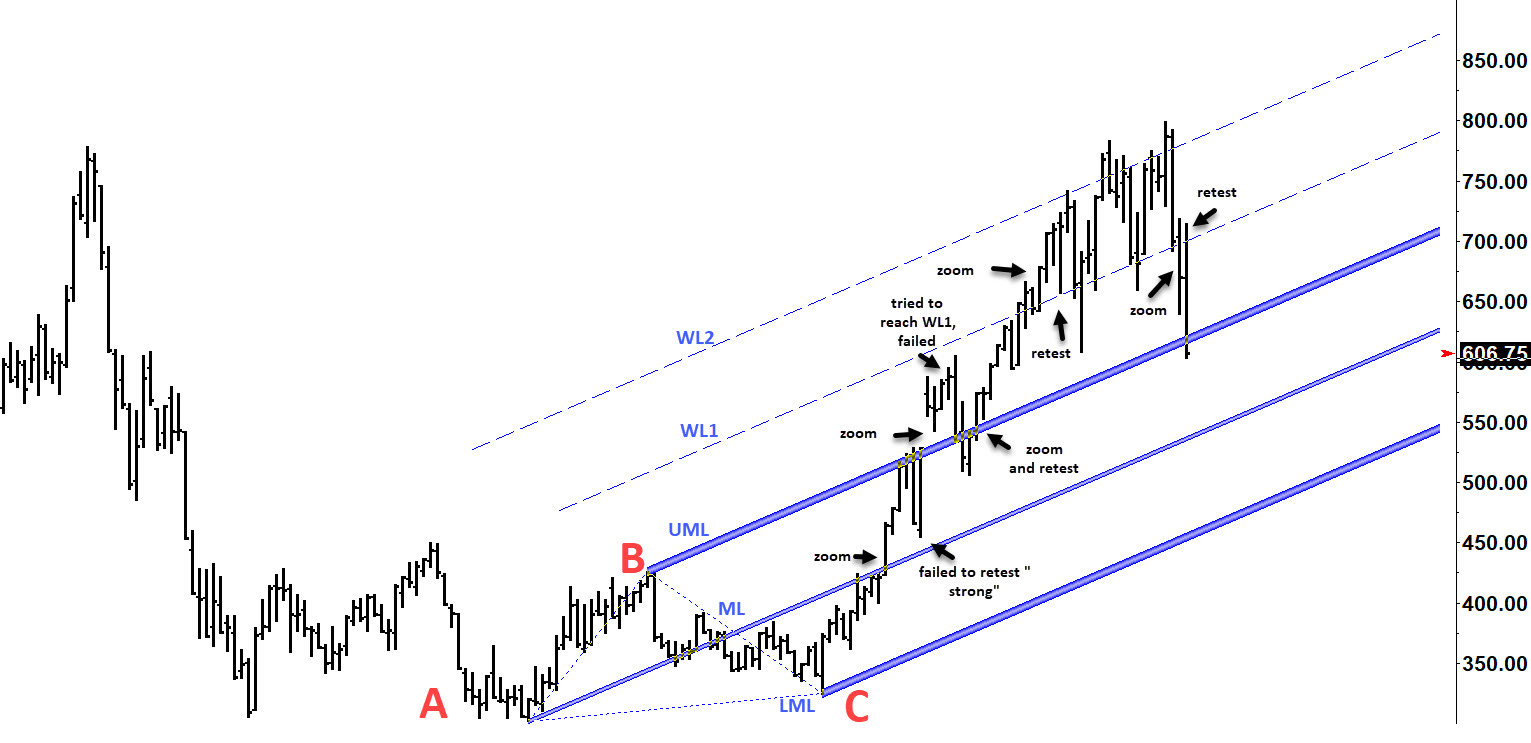
Rule 2. Price will either reverse on meeting a ML or zoom (gap) through it.. When price travels along a ML without zooming or reversing, it will continue until it reaches the next line.
Rule 3. When price passes through a ML, they will pull back to it.
There is a high probability that price will return to test a ML that has been zoomed or gapped. If price does not pullback to retest the ML, price is too strong or too weak to attempt it. In this particular example with Warning Lines which will be covered later, price zoomed (gap) the Median lines exhibiting Doctor Andrews Rule 2. When price zoomed the ML, it went right to the UML, and upon its attempt to retest the ML, it didn’t. That failure to retest was a sign of price strength. When price zoomed the UML, it tried to go directly to WL1, but couldn’t failed. So when price returned to the retest, it tested deep. The weak expression higher created the deeper test of the UML. It should also be noted that price on every advance to new highs did exactly that til it ultimately failed to do so on its attempt to reach WL3 - then falling back through WL1.
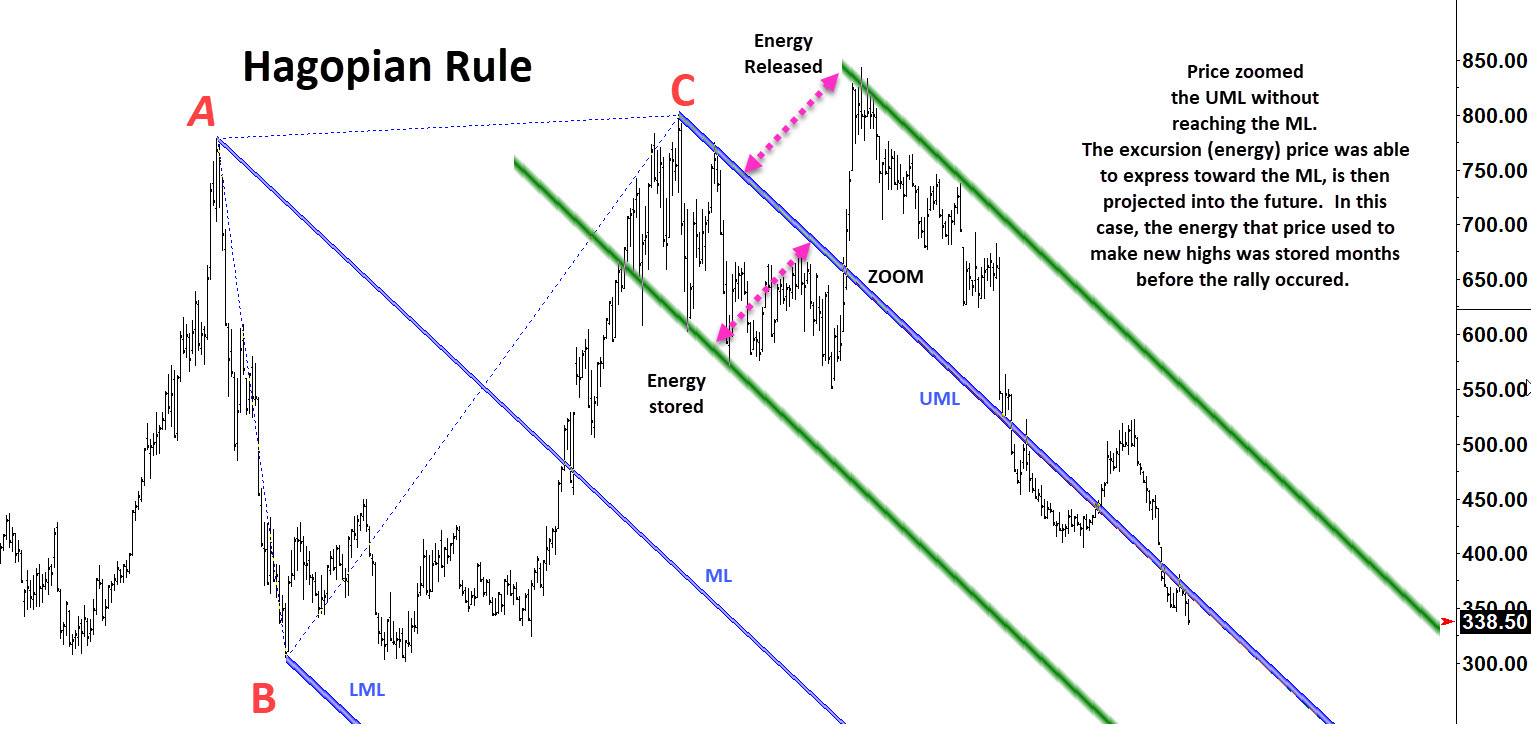
Rule 4 is Hagopian’s rule: When prices reverse before reaching the ML, leaving a “space”, it will move at least as far in the opposite direction . In this chart, price had found a high then worked lower after retesting the upper parallel, till it found a low, then zoomed the UML triggering the Hagopian rule. So you measure the amount of distance that price was able to achieve towards the ML, and project that energy into the future. In this case, price ran out of energy almost tick perfect on the Hagopian Projection.
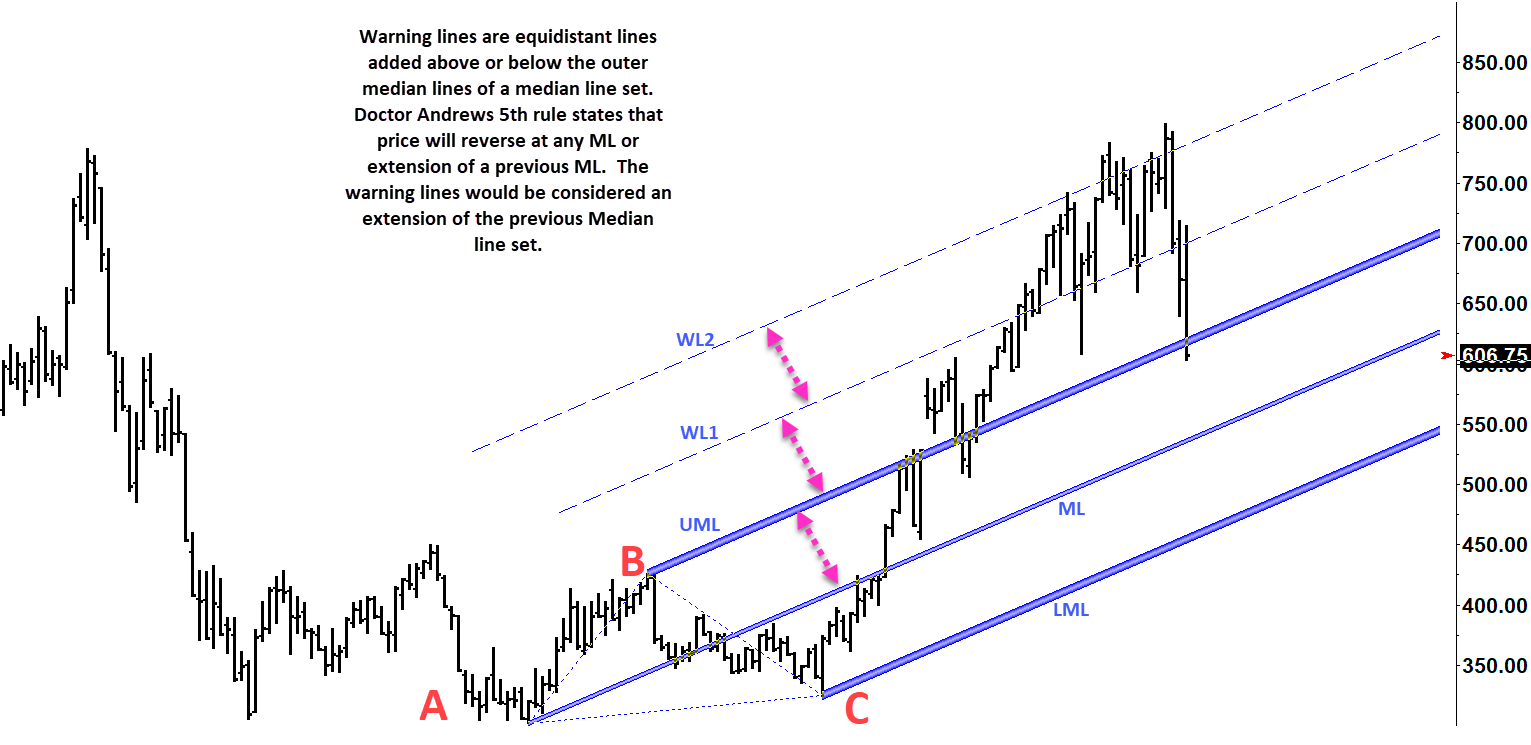
Doctor Andrews fifth median line rule states: Prices reverse at any ML or extension of a prior ML. Doctor Andrews discovered that when price leaves the outer parallels of the original fork, that adding in warning lines - equidistant lines outside the main median line set, act the same as the original Median Lines do. This rule states that all the rules that pertain to the original Median Line, also pertain to the warning lines (WL).
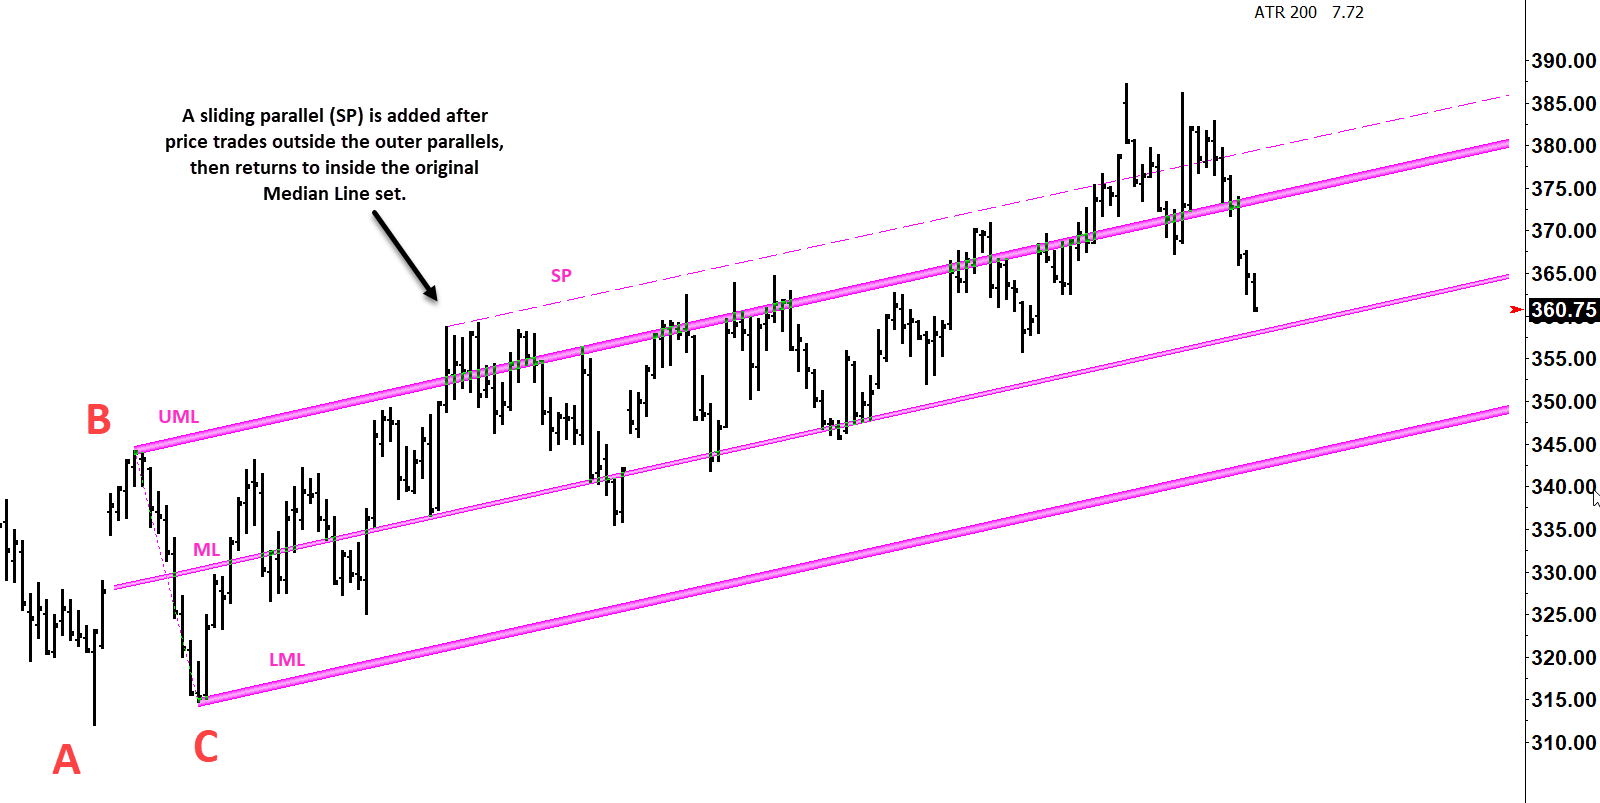
Expanding on the fifth rule – Prices reverse at any ML or extension of a prior ML. On occasion price will poke through a ML for a few bars, then move back inside of the previous ML. In this case a sliding parallel (SP), can be drawn using the same frequency as the ML and added to the depth of the excursion price was able to achieve away from the ML and extended into the future. This sliding parallel (SP) carries the same frequency and probabilities as the original Median Line set or Warning Lines (WL), and Doctor Andrews rules will apply.
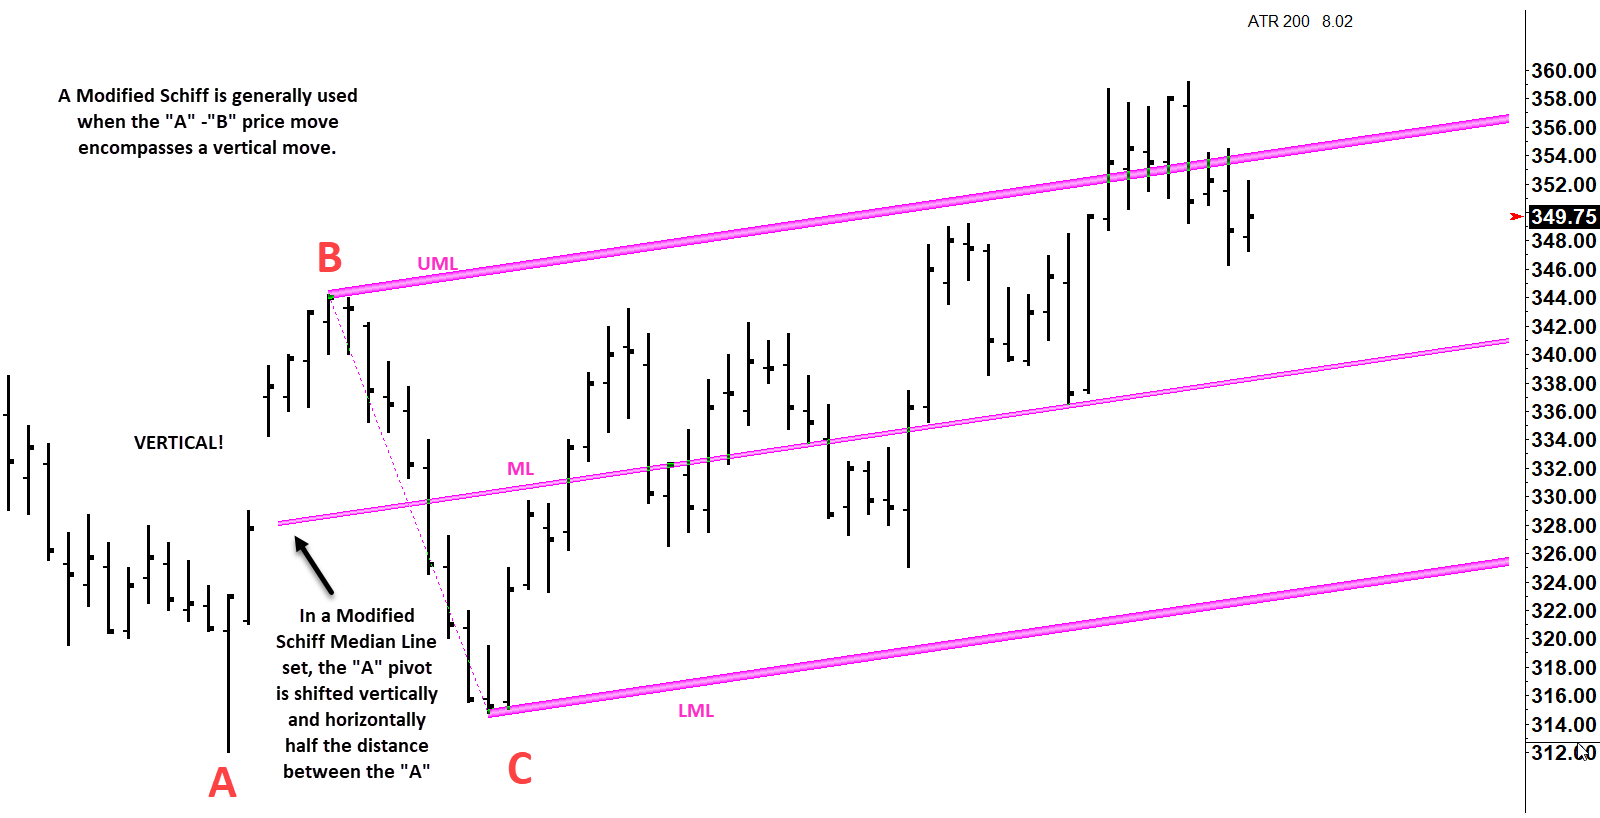
One of Doctor Andrew’s students, Jeremy Schiff was a stock trader. He was frustrated with the tendency of price to be unable to stay within the confines of the outer parallels of a Median Line set after a vertical move. He studied and eventually developed the Modified Schiff (MSML) and Schiff Median Line (SML). These median line types are the same in the way there later pivots are handled, but the “A” pivot is shifted. In a Modified Schiff, the “A” pivot is shifted vertically 50% of the distance between the A-B pivots, and shifted 50% to the right half the distance between “A” and “B”. Jeremy discovered that as a general rule, the Schiff median lines are used when the “A” and “B” encompass a vertical move.
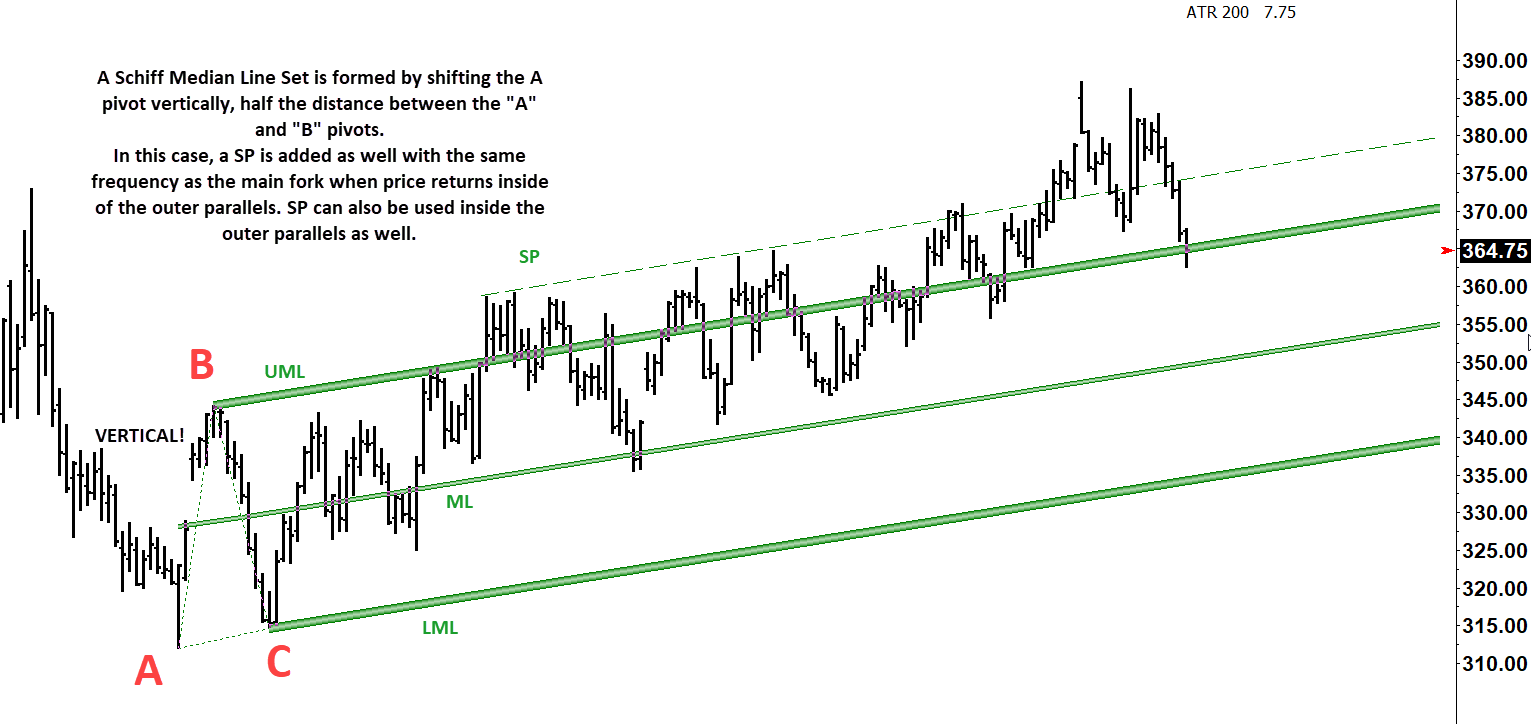
The Schiff (SML) is similarly accomplished by shifting the vertical axis half the distance between “A” and “B”. As you can see, the probable path of price is very similar to what the Modified Schiff frequency suggested, and price respected to rules 2 and 3. This example has a sliding parallel (SP) as well. It could also be argued that in this case, the Schiff median (SML) projected the probable path of price better than the Modified Schiff (MSML) did. Both however, had the same conclusion.
Whether we choose to believe it or not, the world of Median lines is the same world that controls everything that we know of in existence today. Without the immutable rules we take for granted, life would not exist as we know it - if at all. It’s because of those laws, we can put a frame around price that helps us understand what the likely path of price is and what the probabilities are. And it’s because of the great minds that proceeded us that dared to think differently, it’s possible at all.
Hope this is not come off disrespectful, marechals chart was copyrighted in 1933. I just find it so much more important. I appreciate the work and time you have put out there for others.
Thanks for taking the time and energy to write that out Mr. Jenks, very straight forward. I remember well your emphasis on 'do the work', and I have to say that advice has made understanding and seeing these rules play out So much more rewarding. Thanks to both you and Mr. Heller for helping a country boy see a bigger picture.